- ITRES uses ENVI to create custom solutions for customers in the Environmental Industry
- ENVI Helps Researchers Monitor Ecological Integrity
- ENVI Used to Detect Pollutants in Houston
- Invasive Species Management in the Sacramento San Joaguin Valley
- Woods Hole Research Center Using ENVI to Proote Forest Conservation in the Northern Congo
- IDL and ENVI are at the Heart of International Projects with EADS Defense and Security Systems in France
- Scientists Use ENVIto Determine Damage Extents in Earthquake Zones
- Using MERIS Images for Mapping Forest Fire Damage
|
|
|
 |
|
- Customer Challenge
Environmental companies in industries such as forestry, agriculture, water quality mapping, military ordinance detection, and emergency response need complete data analysis solutions. ITRES needed to create a solution for their customers that would employ hyperspectral imagery to analyze environmental issues, including forest silviculture and aquatic characteristics.
- Solution Achieved
ITRES Research Limited of Alberta, Canada builds and supports state-of-the-art airborne hyperspectral imaging systems for studying the environment. They provide complete data analysis solutions to industries like forestry, agriculture, water quality mapping, military ordinance detection and emergency response. The data collection tool central to the imaging systems is casi (Compact Airborne Spectral Imager), the ITRES-developed, push-broom remote sensing device. ITRES' remote sensing systems allow researchers to collect data in a cost-effective, programmable manner. When ITRES' customers need to learn all they can from their hyperspectral data, ITRES suggests incorporating ENVI as the software for remote sensing data analysis.
"The ease of use, ability to handle casi hyperspectral data, powerful algorithms and flexible parameters make ENVI an excellent choice for hyperspectral analysis," says Steve Mah, vice president of commercial applications at ITRES. In the data analysis process, factors such as the sensor and attitude alignments, accuracies of the attitude measurement system, GPS (Global Positioning System), ground control points and the digital elevation model all need to be taken into consideration. This ancillary data, in combination with the hyperspectral data (in the 400 nm to 1000 nm band range, depending on the application requirements), adds up to more than two gigabytes of data amassed during each operational remote sensing flight. In addition, multiple flights are routinely required to scan the entire area under study, further compounding the volume of data until complete images, sometimes as large as 50 gigabytes, are created. ENVI software provides all the tools and data handling capabilities researchers need to determine the accuracy of the data and assess forest silviculture and aquatic characteristics.
"Users usually rely on ENVI's spectral analysis tools, for example the spectral angle mapper and unmixing algorithms, to examine the data that's important to their research," says Mah. ENVI also includes an extensive spectral library, as well as masking and classification routines which complement ENVI's many other image processing and data analysis routines. "Additional forest analysis algorithms are developed using IDL and incorporated with ENVI," says Mah, referring to how ITRES has extended ENVI to meet some of their client's needs.
- Key Benefits
- With ENVI, they can provide their customers with a complete, integrated solution to analyzing their hyperspectral data of forest silviculture and aquatic characteristics.
- ENVI's ease of use, ability to handle casi hyperspectral data, powerful algorithms and flexible parameters has provided them with a cohesive and easily integrated solution.
- ENVI can handle large datasets easily with built-in, powerful routines.
 ENVI provides all the tools and data handling capabilities researchers need to determine the accuracy of the data and assess forest silviculture and aquatic characteristics.
Image courtesy ITRES Research Ltd.
|
|
|
 |
|
- Customer Challenge
Scientists concerned with changes in our ecological systems continually explore new ways to depict important study results which can be instinctively understood by their audience. Static maps and 2D presentations were for decades the only methods for scientists to present results of land studies and scientific research projects. Increasingly, scientists need innovative ways to communicate findings quickly and accurately to policy makers and the general public.
- Solution Achieved
Photorealistic visualization is a way to represent findings by manipulating data to create 3D, dynamic presentations. In an effort to monitor the ecological integrity of protected land areas in Canada and present results, several agencies, including the University of Ottawa's Laboratory for Applied Geomatics and GIS Science in the Department of Geography, have joined forces in a Government Related Initiatives Programme (GRIP)*. GRIP strives to increase the public's awareness of Canada's National Parks via community outreach and education. Team members use photorealistic visualization to help people discover the natural beauty of Canada's National Parks and understand factors that affect its ecological integrity.
GRIP researchers use remotely sensed data and ENVI to perform topographic data manipulation, Earth observation data sourcing, data pre-processing, key environmental feature identification, and photorealistic visualization. In a project that won second place in ExelisVIS's International ENVI Application Challenge, Dr. Mike Sawada and Zoran Reljic of the University of Ottawa, sought to demonstrate ENVI's superior spectral processing capabilities by creating dynamic presentations of Auyuittuq National Park in Nanavut, Canada. The team used a host of built-in ENVI routines to produce 3D, photorealistic visualizations of the park to show the basic landscape and ecological changes over time.
- Key Benefits
- Present data and research findings to their audience in a realistic manner.
- ENVI has the tools and functionality to allow researchers to create the state-of-the-art visualizations.
- Other tools do not provide the breadth of functionality in visualizing data.
Using ENVI's 3D SurfaceViewTM to visualize surface data of the Auyuittuq National Park as :
a) color, b) wire-frame, c) draped with Landsat ETM image and d) draped with IKONOS image.
Image courtesy University of Ottawa
| |
Image courtesy University of Ottawa
|
|

Image courtesy University of Ottawa
|
|
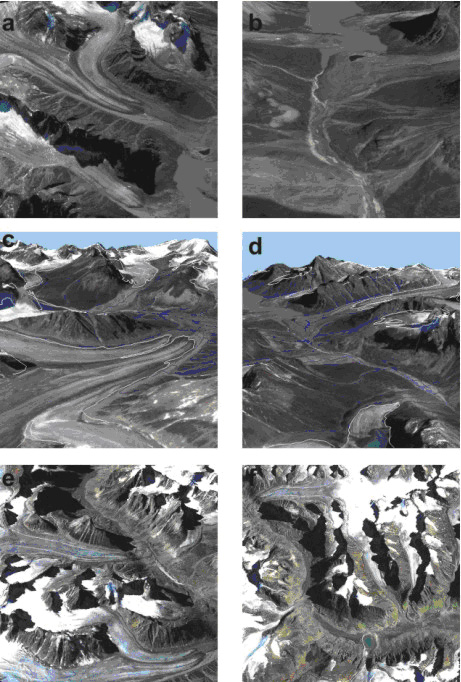
Image courtesy University of Ottawa
|
|
|
|
 |
|
- Customer Challenge
The City of Houston was looking for a way to detect illegal or unauthorized chemical releases or disposal of them on land, in the air or in the water. Their vision was to use hyperspectral imagery to detect, measure and identify pollutant discharges and emissions. Once the detection and measurement had taken place, their ultimate mission would be to help enforce local, state and federal regulations and apply the data as an enforcement tool.
- Solution Achieved
As Americans become more environmentally aware, and scientists present concrete proof about the adverse effects of pollutants to our atmosphere, land, water and subsequently our health, it is increasingly important to enforce laws meant to stop the spread of harmful chemicals. In the past, agencies tasked with enforcing laws and regulations had a steep hill to climb. Detecting the presence of pollutants and chemicals was difficult, and proving what, where, and how something entered the environment was nearly impossible.
Now, through the use of remote sensing technology, and programs such as ENVI, GIS imagery analysts from the City of Houston Environmental Health Division can detect the presence of illegally discharged chemicals by their spectral signatures, and track them back to the point of origin to enforce local, state and federal laws.
The scientific community has used remotely sensed data from aircraft and satellites to identify materials on the Earth's surface for decades. Remote sensing allows researchers and scientists to analyze areas without actually having to be on site. More recently, using remotely sensed data to analyze the spectral properties of materials is a viable option in applications from resource management to agriculture and mining. Identifying materials via their spectral signatures allows analysts to locate and identify different features in data, such as minerals, rocks and chemicals, by means of comparing their spectral signatures with "libraries" of known signatures.
In recent years, a new generation of reasonably cost-effective hyperspectral sensors has been introduced. These sensors produce much more spectral information and higher spatial resolution than traditional remotely sensed imagery sources in panchromatic, or multi-spectral formats with 2 foot to 30 meter spatial resolution. The additional spectral information provides the data needed for the identification of numerous substances based upon their reflectance signature and the higher spatial resolution allows the identification of specific features on the ground facilitating near pinpoint identification of the source and extent of the contamination. ENVI boasts the most robust suite of hyperspectral analysis capabilities available in an easy-to-use package, and is the ideal tool for visualizing, analyzing and presenting this type of data.
The Houston Department of Health and Human Services, led by senior GIS Analyst Larry York, wanted to utilize hyperspectral imagery to facilitate their inspection responsibilities, monitor the environment, and reduce the costs associated with using satellite imagery. Historically, image acquisition was costly, prohibiting experimental uses. Additionally, the available low resolution, multispectral data limited analysis to wide areas, unlike high resolution hyperspectral imagery, which is far more useful in a complex urban environment.
In York's ground-breaking solution, a project carried out and funded jointly with the Environmental Protection Agency, York's team borrowed a City of Houston Police helicopter, which they equipped with a leased hyperspectral imaging instrument called AISA. They sent the helicopter on seven flight lines over the Houston Ship Channel to detect, measure and identify illegal land and water pollutants. They chose the areas of interest because of extensive industrial production and suspicions that chemical spills and unauthorized emissions were occurring there.
Once the data were collected, team members used ENVI's built-in spectral analysis tools, including spectral profiling, spectral plotting, and its Spectral Angle Mapper (SAM) to analyze the flight data for the presence of illegal discharges. The data quickly returned spectral information identifying twenty-five different spectral signatures, which they used to compare to known signatures of chemicals and materials in ENVI's extensive spectral libraries.
After classifying and plotting the data, York's team quickly discovered illegally dumped solvents, as well as petroleum products including diesel fuel, and paint. They then used ENVI to create detailed maps of the chemicals and intuitive visualizations to present their findings.
By zeroing in on the illegal pollutants, York can now immediately send personnel to a site to perform ground truth testing. Before this method was devised, finding the pollutants and identifying them was a shot in the dark, a process made even more difficult when chemicals dissipated quickly in the atmosphere before identification. "Without ENVI, this project never would have happened," said York. "We could have collected the data, but we also needed an application that could process that data effectively."
As the cost of leasing or owning a hyperspectral imaging instrument becomes more reasonable, York and others at the City of Houston hope that departments around the country find the funding to use the technology for similarly innovative reasons.
- Key Benefits
- The City of Houston was able to accurately analyze hyperspectral data from sensors aboard a COH police helicoptor using ENVI
- ENVI's hyperspectral data analysis capabilities gave the City of Houston the tools they needed to identify pollutants from the air
- ENVI has superior spectral data analysis and classifications tools compared with other software solutions.
 Using the hyperspectral data and ENVI, the City of Houston was able to identify areas of toxic spillage in Houston Harbor.
Images credit City of Houston
|
|
|
 |
|
- Customer Challenge
For many years, we have known the threat and adverse effects of invasive plant species on our ecosystem. Long after these species have been introduced, the original populations can continue to spread virally and negatively affect other areas. Scientists needed a unique method of providing a comprehensive baseline for documenting the distribution of the invasive species.
- Solution Achieved
With advanced satellite imaging and image analysis software capabilities scientists can detect the presence of these populations and chart their growth. By developing cost-effective and non-intrusive monitoring and mapping methods, we can begin to understand the significant threat that these plants pose to biological diversity and ecological functioning and begin o manage their impact.
In the Sacramento-San Joaquin Delta Region, the Department of Boating and Waterways (CDBW) and the California Department of Food and Agriculture (CDFA) have become particularly concerned about two major invasive plant species: the Brazilian waterweed and water hyacinth. These species cause significant threats to the region, from interfering with recreational and commercial activities to obstructing navigable waterways and blocking irrigation channels.
This project represents one of the largest airborne hyperspectral image acquisition efforts ever undertaken for vegetation mapping purposes. Because of the need to collect accurate visual data in this enormous project, we employed hyperspectral remote sensing. In the past, both aerial and satellite imagery have been applied to mapping invasive vegetation, but these techniques limited our ability to discriminate between species due to low spectral and spatial resolution. Now, airborne hyperspectral remote sensing has provided us with high-quality, easily analyzed images previously unavailable to researchers.
In recent years, hyperspectral remote sensing has shown promising results for species-level mapping. This advanced imaging technique, coupled with aggressive analysis tools like ENVI software from ExelisVIS, gave us the opportunity to extract information like never before. ENVI's exclusive, flexible spectral suite and a friendly graphical user interface allow researchers to perform image processing end-to end. Its' imaging capabilities range from exploration tools such as the n-D Visualizer to analyzing capabilities with simple wizards or customized algorithms for maximum flexibility.
- Benefits
- Using hyperspectral imaging and ENVI, scientists can now detect and manage sources of invasive plant species which can be harmful to the ecosystem.
- Threats to the ecosystem can be costly to the waterways - both monetarily and health-related. The ENVI solution with hyperspectral imaging is cost-effective, in comparison to potential damage sustained, or to extensive field work to repair damage.
- Alternatively, scientists would have to perform extensive field work, still without the benefits of the overall picture provided by hyperspectral images processed with ENVI.
Infested color mosaic overlayed by the classified pixels.
Images courtesy California Space Institute, UC Davis
| |
A sample plot of six image endmembers used in the classification
Images courtesy California Space Institute, UC Davis
|
Priority sites show coverage of plant species.
Images courtesy California Space Institute, UC Davis
| |
Priority site predominantly of Brazilian waterweed
Images courtesy California Space Institute, UC Davis
| |
A portion of the Delta region, highlighting the location of some priority sites.
Images courtesy California Space Institute, UC Davis
|
|
|
|
 |
|
- Customer Challenge
There is a growing initiative to preserve forested areas in Africa. The Woods Hole Research Center needed a way to map land areas to assess damage and gain an accurate representation of preserved land versus covered land.
- Solution Achieved
In recent years, scientific research, outreach programs, and public education have helped people around the world to become more environmentally conscious - and to understand the impact of our daily life on the planet's ecosystem. A growing number of interest groups work toward a common goal - to maintain the fundamental ecological integrity of our planet, and to ensure that our environment will remain healthy and productive for future generations.
A Change in the Natural Balance
As long ago as the 1970's, scientists became aware that uncontrolled logging in Africa was creating a continent in ecological crisis. Forest clearing has steadily increased since then for many reasons, including huge crop exportations, timber trading, grazing, and slash and burn cultivation. The vegetation loss that results poses a distinct threat to Africa's rain forests, which are home to half of the world's species, provide compounds for 25% of all known medicines, and are the origin to many of our basic foods.
One research organization uses a combination of satellite imagery, field work, and high tech software to play their part in mitigating the problem of deforestation in Africa. The Woods Hole Research Center (WHRC) in Massachusetts is a non profit organization which conducts research, identifies polices, and supports educational outreach to advance awareness of the problem and to find ways to mitigate further damage.
INFORMS Project Educates Local Conservationists
As part of their effort, WHRC created and manages The Integrated Forest Monitoring System for Central Africa (INFORMS), a land mapping program to assess the amount of land damage that has already occurred, and to evaluate how much vegetation remains preserved. The program's goal is to conserve the forests' valuable byproducts - vegetation, soils, water and energy - by demonstrating their inherent value to our health and economic prosperity.
INFORMS uses Landsat satellite imagery and ENVI to create and analyze maps of the Northern Republic of Congo, which is one of the largest rainforests in the world, second only to the Amazon. The area is particularly dependent on the trades of the rainforest for their economic development, a fact that motivated WHRC to focus their conservation efforts. Using satellite data and performing subsequent analyses allows the program to effectively assess areas that are physically difficult to reach in order to perform field work.
Members of WHRC train African local conservationists to use ENVI to analyze the Landsat data. ENVI has been instrumental in the effort, as it is easy to learn and use for non-technical researchers and volunteers. ENVI's rich suite of image processing tools and automated functionality allows any image analyst to create vegetation maps by type, pinpoint areas rich in resources, assess damage to the terrain and focus recovery efforts.
"In the area where I lived in Camaroon, the forest was destroyed in 20 years," said Robert Grosch, a volunteer for the Woods Hole Research Center. "With ENVI, we can illustrate the environmental issues to leaders in this country and abroad."
For more information, http://whrc.org/Africa/INFORMS/study_sites/NdokiActivities.htm
- Benefits
- With ENVI, concerned environmentalists can analyze Landsat images and create accurate representations of land use.
- Logistically, it can be impossible to reach some of the remote areas. Satellite data and ENVI make it possible to perform work in difficult environments.
- ENVI is an easy-to-use, yet powerful analysis package that can be used by any level of image analyst. WHRC staff can quickly train local conservationists to use ENVI to map forest conditions.
 A forester locates an area planned to be logged on a Landsat-derived basemap, created using ENVI.
Image courtesy Woods Hole Research Center
|
|
|
 |
|
- Customer Challenge
EADS needed to create a solution using satellite imagery to enable the National Forest Inventory to identify forest cut inventories.
- Solution Achieved
EADS Defense and Security Systems developed the Metis foret solution, in partnership with the CEMAGREF (Research Institute for Agriculture and Environment Engineering), the IFN (National Forest Inventory), the Research Ministery and the CNES ( French Space Agency ).
"We developed applications with IDL and ENVI because of their friendly and easy-to-use tools," explains Patrice Couillaud, project manager at EADS. "We used a method developed by the CEMAGREF based on wood cutting detection that compares a series of satellite images taken at the same place at a 1-year interval. Thanks to Metis foret, the IFN can locate the cuts made during the year and then evaluate the wood production of a population per year. Moreover, this application enables the IFN to check the accuracy of cut declarations, in particular in the Landes forest in France, by reducing the ground investigations."
- Key Benefits
- Using IDL & ENVI, EADS can now use satellite images, taken at 1 year intervals, and locate cuts made during the year and evaluate the wood production.
- The IDL & ENVI solution, along with satellite imaging, reduced the amount of guess work and extensive field work that would have to be done to determine wood production.
- IDL & ENVI are often requested in the calls for tenders because they enable people to develop specific applications quickly.
 EADS created a solution to enable the National Forest Inventory to identify forest cuts inventories
Image courtesy EADS Defense and Security
|
|
|
 |
|
- Customer Challenge
Earthquakes can cause extreme damage, not only to personal property, but to natural landscapes and infrastructures. Identifying the scope and amount of dame casued by an earthquake is vital for many reason, including disaster response and aid. The identification of damage due to large earthquakes is vital to grasping the level and extension of the hard-hit areas. Researcher Miguel Estrada needed a way to easily and quickly create visualizations and assess the amount and scope of damages.
- Solution Achieved
In the event of large natural disasters, like a destructive earthquake, a fast assessment of the damaged areas is required to send off rescue teams. The identification of damage from a large area gives essential information that authorities can use to plan rescue procedures as well as to draw a general idea of the magnitude of the damage.Using remotely sensed images from satellite data both before and after a natural disaster, Estrada and fellow scientists Masashi Matsuoka and Fumio Ymazaki used ENVI to compare the ratio between different bands of the pre and post event images to detect damage.
To assess the damage using the images, the team based their work off of the general premise that changes in land cover result in changes in radiance values, and changes in radiance due to land cover change are large with respect to radiance changes caused by other factors such as differences in atmospheric condition, differences in soil moisture and differences in sun angles. Using these premises, they were able produce change detected images using the images spectral information. These processed images can be easily compared to satellite images taken before the event, and the land damaged is clearly visible. In addition, using the image's spectral information allows them to detect the type of landcover in question, information that is useful when determing dollar value of loss and recovery plans.
This type of research is extremely valuable for the government and other organizations who assist in post-catastrophe management. By using advanced spectral processing tools included in ENVI, the Estrada team was able to add a valuable asset to the recovery tools used after a disaster.
- Key Benefits
- Using ENVI, they can now compare the ratio between different bands of the pre and post event images to detect earthquake damage.
- Without remote sensing and ENVI, there would be considerably more, expensive field work involved.
- ENVI's built-in change detection routines were essential in comparing pre- and post-earthquake images.
Composite color image Red=Band 7, Green=Band 5 and Blue=Band 1. Raw image.
Images courtesy Miguel Estrada, Masashi Matsuoka and Fumio Ymazak
|
|
|
 |
|
- Customer Challenge
Forest fires, with the capacity to devastate landscape quickly and totally, are a threat to ecosystem functioning in the areas of biodiversity and hydrology. By releasing carbon dioxide, they can also affect global atmospheric chemistry. A system to map the extent of the damage and plan recovery efforts has become a priority around the world.
- Solution Achieved
Wildfires play a critical role in many aspects related to ecosystem functioning such as biodiversity and hydrology, and they are increasingly a source of concern for environmental protection and security. Biomass burning has been on the rise for decades. In fact, in Europe, the five Mediterranean States endured an astronomical 300% increase of forest fires from 1980-2003. Remote sensing continues to play a crucial role in extracting timely and harmonized information on these disasters. Using sophisticated remote satellite sensors, such as the European Space Agency's Medium Resolution Imaging Spectrometer (MERIS), researchers can better obtain images and estimate the amount of damage caused by forest fires.
Disaster Help with Remote Sensing
Highly accurate data images help agencies plan post-fire restoration efforts in many ways. First, scientists can determine which areas are most acutely affected, thereby spending the largest amount of relief dollars in those regions. In addition, information on forest fires is strategic for Kyoto Protocol implementation and treaty verification. The Kyoto Protocol intends to limit or reduce carbon dioxide and other greenhouse gas emissions an average form a benchmark determined in 1990, and wild land fires are a significant source of greenhouse gas, especially in tropical areas.
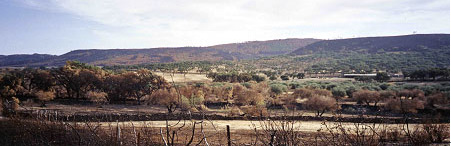
Researchers from the Remote Sensing Laboratory in Madrid, Spain have released preliminary results on forest fire damage and burnt area assessment for a fire on the border of Portugal and Spain during the first days of August 2003. The summer of 2003 was a particularly dramatic season in much of Southern Europe, especially in Portugal, where almost 8% of the forested area was burned.
Employing highly accurate remote sensing to obtain data and ENVI to perform data analysis, the study area was effectively mapped and examined. The MERIS sensor and subsequent analysis has have proven to be accurate tools in estimated the damage level of forest fires. The multispectral capabilities of Meris in the visible and near-infrared regions and narrow spectral band give scientists the benefit of improved spatial resolution compared to traditional sensors, such as NOAA's Advanced Very High Resolution Radiometer (AVHRR).
Analyzing the Damage
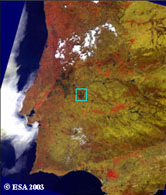
The study area, known as Valencia de Alcantara, was delineated on a MERIS image using, and all of the analysis was carried out on one working frame with ENVI and IDL 4.0. Using ENVI's convenient built-in algorithms, including the linear unmixing algorithm, they created a post-fire sub-scene of the MERIS image, as well as a post-fire SPOT-5 image obtained on August 21 2003. The SPOT-5 is a a four-band image with a 10 meter spatial resolution, with two visible spectral bands, a third in the near infrared and the fourth in the shortwave infrared region.
The applied algorithms produced an estimate for the level of damage caused by the fire to give the researchers more concrete data, and this estimate was reclassified into two degrees of affection: high and very high. This SPOT-5 image, with its improved spatial resolution and proper spectral capabilities, was used as the 'ground truth' for evaluating MERIS estimations of damage and affected area.
Field Data and Results
Though remotely sensed data is crucial to assessing the extent of damage after a fire, field work is also critical for continued analysis. Two different trips allowed the team to verify what they had found in the remote sensing estimations. The first trip was conducted a few weeks after the fire was extinguished, while the second was carried out the next summer, during the following vegetative period.
Ground data from the first trip revealed the degree of devastation caused by the fire, while in the second trip the team assessed clearing works on ravaged areas and documented signs of recovering vegetation. Linking pictures of several locations to GPS coordinates and MERIS and SPOT-5 images showed a tremendous correlation between damage found by the satellite sensors and the subsequent field work.
In an effort to analyze the effects of the fire on specific forest species, MERIS-derived information on the damage was compared with information on land cover classes taken from the Spanish National Forest Map. Analysis revealed that all the species in the burn area were affected equally, unlike in other geographic locations, where some tree species are more resistant than others.
The data collected in this study is extremely beneficial to people planning restoration efforts. Government subsidies can be distributed appropriately to damaged areas, and future landscaping can be planned to include more fire resistant species. Without the high resolution capabilities of remote sensing and highly analytical software such as ENVI, researchers would not be able to provide this crucial information to the public and the agencies that monitor our planet.
- Key Benefits
- Map and analyze the extent of forest fire damage.
- Responders can determine damage and focus efforts before going into the field.
- Extensive field work would have to be conducted without the use of satellite imagery and ENVI.
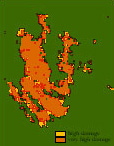
Fire scars are seen in Central Portugal and Spain. Left: RGB: 12,9,1 composite. Right: RGB: 3,2,1 composite.
Images courtesy Remote Sensing Laboratory, INIA, Ministry of Education and Science.
Images courtesy Remote Sensing Laboratory, INIA, Ministry of Education and Science.
Images courtesy Remote Sensing Laboratory, INIA, Ministry of Education and Science.
Images courtesy Remote Sensing Laboratory, INIA, Ministry of Education and Science.
Images courtesy Remote Sensing Laboratory, INIA, Ministry of Education and Science.
|
|