- 미해군 무기과에서의 IDL 활용 사례
- 해양 자료 분석과 자료 가시화
- Used in NASA's SeaWIFS Project
- Oceanographers Use IDL to Visualize World Topography
|
|
|
 |
|
|
IDL Provides Improved Visualization and Application Development for Naval Air Warfare Center
Professional Services Group helps plan and develop IDLRAP application
 The Naval Air Warfare Center - Weapons Division (NAWCWD) of the Naval Air Systems Command (NAVAIR) supports Department of Defense and foreign military branches by monitoring and providing reports on operations test data that is gathered from a variety of platforms and sensors. The data is analyzed and distributed by the Pacific Ranges and Facilities Department at the Naval Air Warfare Center (NAWCWD), located in Point Mugu, California. Using IDL, the NAWCWD has built an integrated development environment, called IDLRAP, that allows the user to interactively analyze data and more quickly develop applications, and has thus revolutionized the way traditional post-mission data products are processed and distributed to customers.
Image shows the data display and file management widgets in IDLRAP. The graphics display shows the change in position of the measuring device over time during a flight test, using Global Positioning System (GPS) data. Here the user has selected a range of data (highlighted in gray) that contains "bad data," which will be interpolated to smooth out the noise.
The Naval Air Warfare Center - Weapons Division (NAWCWD) of the Naval Air Systems Command (NAVAIR) supports Department of Defense and foreign military branches by monitoring and providing reports on operations test data that is gathered from a variety of platforms and sensors. The data is analyzed and distributed by the Pacific Ranges and Facilities Department at the Naval Air Warfare Center (NAWCWD), located in Point Mugu, California. Using IDL, the NAWCWD has built an integrated development environment, called IDLRAP, that allows the user to interactively analyze data and more quickly develop applications, and has thus revolutionized the way traditional post-mission data products are processed and distributed to customers.
Image shows the data display and file management widgets in IDLRAP. The graphics display shows the change in position of the measuring device over time during a flight test, using Global Positioning System (GPS) data. Here the user has selected a range of data (highlighted in gray) that contains "bad data," which will be interpolated to smooth out the noise.
Seven Goals Prompt IDLRAP Development
Head of Data Products, Bill Karr, and his team had seven specific goals in mind when they developed IDLRAP. First, they wanted to satisfy customer requirements in a timely and cost-efficient manner by developing "production ready" applications more quickly and efficiently. Second, they needed to reduce the overall development and maintenance costs associated with application software over its lifecycle. Third, they wanted to leverage the current COTS technologies in their production environment. Fourth, they wanted to migrate from a FORTRAN-based legacy system to one that supports object-oriented (OO) methodologies.
|
"Research Systems' Services Group was able to demonstrate IDL in our environment, using our data. That exercise proved to our data analysts that IDL could do the job. Our group also took part in ExelisVIS's training programs. By completing all of the training offered by ExelisVIS - the Intro to Advanced courses, we will likely save an estimated six months of time."
|
"We had a 'skills mix' issue within our organization," explained Karr. "We needed a powerful tool that was easy to learn and integrate, and was somewhat forgiving. Such a tool would enable us to utilize the talents of existing team members as well as get them up to speed quickly while they learned to use the new tools and methodologies associated with OO programming."
Fifth, the team wanted a package from a company that provided the highest quality training and support. Six, they needed to support the NAVAIR organization commonality objectives, such as providing a library of "common" routines that could be shared among various entities within the organization. Lastly, they wanted to build an application that could one day be easily migrated to the Internet.
IDLRAP Enhances Current System Architecture
IDLRAP enables the NAWCWD to take full advantage of its current architecture, the Range Data System (RDS) architecture, which is implemented at the Sea Range (Point Mugu). RDS is a distributed, PC-based networked environment integrating COTS tools and solutions. RDS enables the data analyst to access data within seconds after it is collected in a real-time mode from both instrumentation sensors like RADAR and GPS, as well as Telemetry sources such as ships, aircraft, missiles, and various other control systems. Data types include TSPI (Time, Space, Position, Information data) and real-time telemetry data. Data sets vary in size from a few kilobytes to several hundred megabytes.
"Advancements in COTS hardware and software technologies have enabled our data analysts to interactively process and visually analyze data samples collected from various Range instrumentation sensors and platforms on the desktop. What we wanted to do with IDLRAP was to enhance those traditional processing and analysis methods," said Karr.
"The basic concept of operation within the IDLRAP application is straightforward," he continued. "IDLRAP reads data, processes the data interactively via a graphical, visual interface that is in accordance with customer requirements using methods, techniques and algorithms generally accepted in the data reduction environment, and generates a final data product. The data analyst has a variety of functionality, such as folders, tabs, dialog boxes, windows, and buttons available that offer options to process and generate final data products."
IDLRAP is being implemented at the NAWCWD on a PC-based platform running Microsoft Windows NT. The application is extensible and provides the application developer with an integrated development environment. Support for external library access is provided within the IDL framework and is available via the "Linkimage" and "Link External" capability. Routines common to the data reduction process, such as filters, transformations, and refraction correction, can be external to the IDL environment if it is required or is desirable. "Essentially, a 'C' wrapper is written around the external routines that work with IDL interfaces," explained Karr. "This feature enables the us to support organizational commonalty objectives by linking to a library of routines common to the data reduction environment."
The users of IDLRAP include data analysts, mathematicians, computer scientists, systems analysts, computer programmers, scientists and engineers. With IDLRAP, the user can now perform a variety of interactive functions, including selective editing, merging, best source selection, filtering, interpolation, refraction and bore-sight corrections to raw data samples, and generate more sophisticated final customer data products.
ExelisVIS's Professional Services Group Helps NAVAIR Achieve Goals
The development of IDLRAP, from requirements definition to a final delivered product, took approximately three months. "One of our core requirements for IDLRAP was a user-friendly interface. Our in-house developers are knowledgeable in the algorithms and processes unique to our business, but not in object-oriented methodologies and the IDL language. Therefore, we asked the ExelisVIS Services Group to help us develop the Graphical User Interface (GUI) while our NAWCWD team focused on the routines core to our business and the applications that generated 'final' customer data products."
"Research Systems' Services Group was able to demonstrate IDL in our environment, using our data. That exercise proved to our data analysts that IDL could do the job," said Karr.
"Our group also took part in ExelisVIS's training programs," continued Karr. "By completing all of the training offered by ExelisVIS - the Intro to Advanced courses, we will likely save an estimated six months of time," said Karr.
Integration of ION is Next Step in IDLRAP
IDLRAP is a work in progress, according to Karr. "The next step is to integrate ExelisVIS's ION tool into our production environment. ION will enable our customers to have direct access to their data products using web-based technology in a manner that is non-intrusive to their desktop. ION enables someone to use an ordinary browser to view data and data products that we generate; that keeps it very simple and straightforward for our customers."
"IDLRAP has given the data analyst more power at his immediate disposal, which was one of our primary goals at NAVAIR. In the past, it took significant time and effort to develop an application here at the NAWCWD. Now, the data analyst can more readily adapt to changing customer requirements. We still write code, but in those instances where we need to do something fast and direct, we now have the power and the tools on the desktop to do so," Karr continued.
"Although we have achieved our original goal, much work remains to be completed and integrated into the IDLRAP application, as we are trying to capture the best features and capabilities of our legacy tool and integrate them. Our legacy system represents a collection of more than twenty years of application libraries and routines that support the production team. The hard work and dedication of our team members will ensure successful transition to IDLRAP," Karr concluded.
IDL is a registered trademark of Research Systems, Inc. All rights reserved.
|
|
 |
|
|
IDL, a tool for oceanographic data visualization and analysis
Under the scorching sun of Perpignan, in the heart of the French Pyr??s, next to the Spanish border, a team of oceanographic researchers is developing a software for the visualization and analysis of oceanographic data using several instruments (i.e., CTD (Conductivity-Temperature-Depth), current meters, sediment traps, and optical and meteorological sensors) that are simultaneously deployed in several points.
Searching for a common language
At the beginning of 1999 Ms. Dimitra Kitsiou, a post-doctoral researcher, was hired by the Centre de Formation et de Recherche sur l'Environnement Marin, the CEFREM, to develop a software for the visualization and space- and time-related analysis of miscellaneous oceanographic data.
At its inception, the project resembled the tower of Babel. Many research centers acquire oceanographic data on a permanent basis, which is then archived, shared and analyzed by scientists all over the world. However, these data are saved in several formats and users work with all kinds of operating systems; therefore, every time data are transferred users are faced with tricky reading and compatibility issues.
Finding a multipurpose tool
Ms. Kitsiou thus set out to develop a tool for reading oceanographic data.
"In oceanographic studies," says Ms. Kitsiou, "researchers are interested in data as varied as temporal series of winds, currents, temperature, biological and chemical parameters of water, particle flows, etc. For this reason, different types of instruments are used simultaneously and, therefore, many types of data are recorded. Finally, because many laboratories work on joint projects, these data are often saved in differing formats. The result is hindered data access and analysis. We needed software that would read, visualize, and analyze any type of data, in all existing environments. We also wanted our work to include (scale and vector) cartography and animation. The latter would enable us to easily visualize long-term changes in the marine environment."
The CEFREM's project was designed in cooperation with the Barcelona Marine Sciences Institute and follows the VADO (Visualization and Analysis of Oceanographic Data) program. Each operating system environment is represented: Perpignan works on Macintosh and Windows and Barcelona runs on UNIX. Files are in ASCII format and are as big as several hundred kilobytes.
...and easy to use
"We needed a software that was very user-friendly! Our users are not information technology experts," adds Ms. Kitsiou. "When I arrived here, there were routines in two different languages, IDL and FORTRAN. We have decided to keep only IDL (Interactive Data Language) because it is easier to use and faster for data visualization. IDL is not only easy to use when learning to create routines, it is user-friendly in all its features."
Free access to the Internet
My role is to develop a standard software application, a multipurpose tool for analysis of two- and three-dimensional visualizations for any oceanographic data, wherever they originate from. Thanks to IDL, we're almost there. Ultimately our vision for this application goes further. We want to allow free access to our software on the Internet."
 |
Figure 1. Bathymetry map of the Mediterranean Sea.
|
|
 |
Figure 2. The form the user should fill in for each different file format in order to have access to the various data sets.
|
|
 |
Figure 3. Zoom in the Gulf of Lions, France and visualization of the positions of the nine sampling stations of the High Frequency Flux (HFF) experiment.
|
 |
Figure 4. Information concerning the sampling sites selected by the user.
For example, in the sampling station LINE 1 there is a sediment trap at 300m depth and a current meter at 165m depth. The recorded parameters are (a) the total mass flux and (b) the direction, velocity, temperature and pressure of the water mass.
|
|
 |
Figure 5.
(a). Time-series of temperature for LINE 1, 2, 3, 4 recorded from the current meters at 165 m depth.
(b). Averaged time-series of temperature (NSUM=50) for LINE 1, 2, 3, 4 recorded from the current meters at 165 m depth
|
|
|
 |
|
- Customer Challenge
Because of the highly distributed nature of the user base for data provided by the SeaWiFS project, NASA needed to develop a custom application that would allow scientists around the globe to access the remote sensing data over the Internet and analyze the data in a manner that consistently adheres to rigid scientific standards.

- Solution Achieved
In the 1990s, prior to the start of the SeaWiFS Project, NASA provided scientists with platform specific UNIX based applications to allow those with older computers to handle and analyze the large image files. Not only were significant development resources required to design and maintain these applications, but the applications were complex and difficult for end users to work with.
SeaDAS is the primary data analysis software for NASA's SeaWiFS Project. Remote sensing data collected by SeaWiFS' satellite instruments is used by oceanography and ecology scientists around the globe for important research about the health of the Earth's oceans, climate trends and the impact of those factors on micro and macro biological systems. The program is part of NASA's Earth Science Enterprise, a long-term, coordinated research effort to study the Earth as a global system.
Developing an Award-Winning Application
|
"Developing an application of this size and complexity would normally take a large staff and an equally large budget, but IDL allowed the SeaWiFS team to develop the original application with just a staff of three," said Chuck McClain. "Instead of building complex components from scratch, the SeaWiFS team took full advantage of IDL's large library of analysis algorithms," said Mark Ruebens, SeaDAS Manager. "In addition, IDL's GUI development tools have been invaluable in streamlining one of the most time-intensive parts of the development process.
An application like SeaDAS requires an interface that meets the needs of novice users of data analysis software as well as power users who want advanced capabilities. That would be a huge job without IDL." Using IDL, the SeaDAS development team was able to create a very powerful application that can handle the large data sets used by the scientific community. These data sets can range in size from 20-100MB for SeaWiFS imagery to 500MB for imagery from the newer MODIS satellite instrument.
|
|
"One of our goals was to design SeaDAS to focus on the heavy lifting of image processing, and give our end users a lot of flexibility to build their own analysis routines on top of that. IDL allows us to do that because it gives scientists the right tools to easily add custom analysis features to suit the specific nature of the research they are doing," said McClain. "Our team has also been able to maintain a very aggressive schedule of upgrades since the launch of SeaWiFS with just a staff of two or three," said Ruebens. "That has made the SeaDAS project very cost-effective for NASA." Upgrades since the launch of SeaWiFS have included a move to Linux, meeting the needs of a growing international user base that predominantly relies on lower cost Linux-based systems.
|
- Key Benefits
"One of our goals was to design SeaDAS to focus on the heavy lifting of image processing, and give our end users a lot of flexibility to build their own analysis routines on top of that. IDL allows us to do that because it gives scientists the right tools to easily add custom analysis features to suit the specific nature of the research they are doing," said McClain.
- "Developing an application of this size and complexitywould normally take a large staff and an equally large budget, but IDL allowed the SeaWiFS team to develop the original application with just a staff of three," said Chuck McClain.
- The SeaWiFS choice of IDL was a decision that was embraced by people around NASA who have been using IDL for numerous other visual data analysis projects.
|
|
 |
|
- Customer Challenge
Oceanographers at Millersville University Earth Sciences Department needed a solution for displaying and analyzing large, complex data sets in an easy-to-use graphical user interface.
- Solution Achieved
Because oceans vary dramatically in depth and elevation, massive amounts of data on land elevation, ocean depth, contours and water properties must be collected and analyzed. These complex data require a robust software program that can quickly process and display the information in a meaningful and informative way. At the Millersville University Earth Sciences Department, data comes largely from federal government laboratories and includes a range of data types such as earth surface elevation, seawater properties, and satellite remote sensing data. These data files range in size from 10 to 30 megabytes.
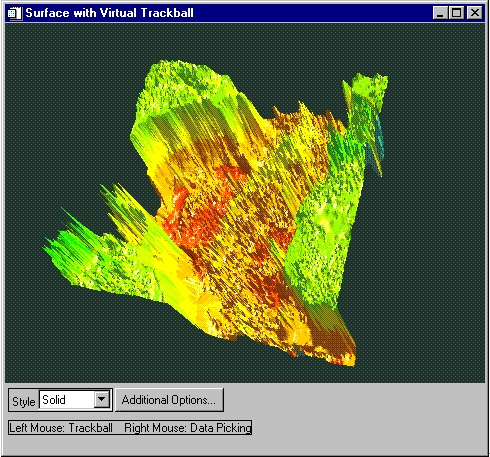
Using IDL as the programming language, Millersville's Yin Soong developed the World Topography Viewer. This multi-faceted application comes complete with a user-friendly GUI and allows geoscientists to:
- View any elevation point on Earth
- Plot elevation profiles around the world at any latitude or longitude or between any two arbitrary points
- View topographic animations of a rotating Earth
- View 3D images or contours
- View topographic animations of a rotating Earth
To develop the World Topography Viewer, Soong used a variety of IDL routines, primarily widgets, plots and contour routines. According to Soong, "The ease of manipulating multidimensional data and the robust GUI," are IDL's best features.
- Key Benefits
- With IDL, he can create custom applications to efficiently handle ocean topography.
- Soong estimates he's saved at least ten months of development time by using IDL over another program such as Visual Basic.
- Soong tried FORTRAN, VisualBasic, QuickBasic and various spreadsheet programs to solve his problem, but none of them allowed him to interactively display and analyze oceanography data on different operating systems. He selected IDL for its array-oriented design, robust GUI, versatile procedures, and object-oriented programming features.
 Geoscientists and researchers actively study the world's many bodies of water to understand the physical, chemical, biological and geological aspects of the oceans and the impacts of environmental factors on topography.
Image courtesy Millersville University
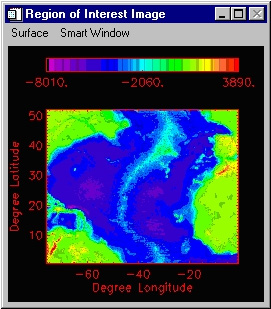 Image courtesy Millersville University
|
|