- A New View on Weather - Australian Company Provides Weather Forecasting Software for Asia
- Columbia Uses IDL to Make Learning Climatology Possible fo Anyone
- Eye of the Storm - IDL Integral in Analyzing Satellite Imagery Used for Storm Tracking
- IDL Helps Visualize Complex Earth Data in NOAA's "Science on a Sphere Project 15
|
|
|
 |
|
- Customer Challenge
Environmental Systems and Services needed a flexible development environment with built in image analysis capabilities for developing a meteorological forecasting tool
- Solution Achieved
Engineers and visionaries at Environmental Systems and Services (ES&S) have developed technology that makes weather forecasting easier than ever. Using IDL for development and commercial distribution, the Melbourne, Australia-based company created METEOR, a robust software application used by forecasters in Australia and throughout Asia for meteorological observation and forecasting.
METEOR was developed by ES&S in 2000 after the Hong Kong Observatory, Hong Kong's meteorological bureau, needed a complete package that integrated ES&S' satellite antennas with a robust, but easy-to-use, image display and analysis application. Up to then, ES&S was primarily a hardware company, providing satellite antennas and receiving equipment to Australasian weather bureaus. Their new customer had stringent requirements for intuitive, powerful software. Project manager Gary Quinn researched many pre-built image processing packages, but none met all of the Observatory's requirements for image analysis and data dissemination.
IDL Provides a Complete Development Platform
To provide a solution with all the functionality they needed, Quinn organized the company's first software engineering team and selected IDL as the development platform for the application. "We chose IDL for several reasons," said Quinn. "IDL allowed for quick development, provided many libraries, and had cross-platform capabilities. We didn't want to write different versions of the same routines for Windows and Linux." In the end, they developed a complete satellite image analysis package, which is now commercially available around the world.
The METEOR system manages two primary meteorological activities ? climatology observation and weather forecasting. Using IDL for development allowed engineers to provide their end users with automated tools for many image processing tasks associated with those initiatives. The software supports data formats from the most utilized satellites, including NOAA HRPT, FY1 CHRPT, GMS SV, MTSAT, GOES GVAR, and MODIS from Terra and Aqua. In addition, the software allows users to output files in common image formats, such as .png, jpg, and .tiff.
Making Observations in Real-Time
METEOR was designed with operational forecasters ? not researchers ? in mind. It allows real-time, meteorological observation using advanced, yet easy to use navigation and calibration tools. "Real-time observation is a must for meteorologists," said Quinn. "METEOR's automated functions quickly process raw satellite data into information directly useful for forecasting and observing the weather." IDL's ability to easily manage and manipulate data, and a rich library of mathematical algorithms allowed developers to provide not only the means for handling large amounts of raw satellite data, but to integrate advanced data visualization in real time with an intuitive user interface.
The METEOR GUI requires very little training, while providing the user with buttons and sliders for a wide range of forecasting functions. This allows a forecaster to track many types of meteorological phenomena, including cloud cover, cyclone development, and other storm fronts. To develop an interface this sophisticated, yet user friendly, required IDL's flexibility and built-in functionality. Said Quinn, "IDL requires less programming than other platforms to produce advanced functionality, and it allowed us to design a standard GUI with buttons, sliders and all the functions forecasters would be accustomed to using in any software application."
METEOR's Intuitive Workflow
In addition to real-time observation, METEOR also recognized the need for advanced forecasting mechanisms by providing an intuitive workflow. The user can choose pre-defined processing templates, called "setups", or create their own. These templates are then used by the software to automatically produce geo-referenced, calibrated images according to the parameters defined in the setups. Users can also perform most meteorological processes easily by using menu items, including image zooming and panning, generating transects and histograms, creating scatter plots, isolines and contours, and much more.
An important feature of METEOR is its ability to perform time lapsed tracking with an automated animation tool that creates movie loops of multiple images taken over time. The user simply chooses a raw image, selects animation parameters, and the system generates an animation loop, automatically updating the display window as new images are available. The tool can continue animating and updating in the background while other processes occur.
METEOR, is now installed on systems in Hong Kong, Indonesia, Malaysia, Taiwan, and Australia. For more information, please visit www.esands.com, or email Gary.Quinn@esands.com.
- Benefits
- Their end users now have automated tools for many image processing tasks to use for climatology observation and weather forecasting.
- IDL allowed for quick development, provided many libraries, and had cross-platform capabilities. They didn't need to write different versions of the same routines for Windows and Linux
- IDL required less programming than other platforms to produce advanced functionality, and it allowed them to design a standard GUI with buttons, sliders and all the functions forecasters would be accustomed to using in any software application.
METEOR's main window allows operators to select a range of images and functions Images credit ES&S
|
METEOR allows multiple images to be analyzed simultaneously Images Credit ES&S
|
Combining satellite imagery with NWP generated GRIB data Images Credit ES&S
|
METEOR allows multiple images to be analyzed simultaneously Images Credit ES&S
|
|
|
 |
|
- Customer Challenge
Columbia University needed to make a Global Climate Model teaching aid for high schools, universities, and anyone else interested in learning about meteorology and climatology.
- Solution Achieved
Columbia Univesity, in cooperation with NASA, developed a free Global Climate Model using IDL, which is now available for high schools, universities, and anyone with a personal computer. The software is a result of an effort by the Educational Global Climate Modeling (EdGCM) Cooperative. The EdGCM Project develops software applications that help people set up, operate and manage complex 3-D computer simulations of the Earth's climate system. The EdGCM software runs on a desktop computer and is easy to use for computer users of all levels, making it possible for anyone to learn about climate science by running simulations similar to those used by researchers using supercomputers. Simulations may include models of past, present, and future climates.
To provide users with the ability to create line plots, maps, and vertical cross sections of hundreds of climate variables, project engineers developed the EdGCM Visualization Application (EVA), an advanced yet easy-to-use visualization program, built using IDL as its primary graphics engine. EVA is supported by the National Science Foundation's Division of Atmospheric Sciences, Paleoclimate Program and NASA's Earth Science programs. In March, 2006, a new version of EVA was released for download, and it includes additional map projections, such as the satellite view, regional zooming, global and hemispheric averages, and array differencing.
"The real goal of EdGCM is to allow teachers and students to learn more about climate science by participating in the full scientific process, including experiment design, running model simulations, analyzing data, and reporting on results via the Web," said Mark Chandler, lead researcher for the EdGCM project from Columbia University, New York, "IDL's built-in capabilities allowed us to develop a robust visualization tool that is easy to distribute."
For more information about the EdGCM Project visit: http://edgcm.columbia.edu, or download the software and manuals at: http://edgcm.columbia.edu/download
Details about EVA development are available at http://dev.edgcm.columbia.edu/wiki/EVA
- Key Benefits
- Using an IDL-based solution, anyone with access to a personal computer can now conduct climate experiments that previously were only available to scientists with supercomputers.
- The IDL application is easily distributed and allows EdGCM to provide the application to almost anyone
- Before the IDL solution, teachers and students were limited in the scientific process as it relates to global climate modeling. Now, they can participate in the full scientific process, including experiment design, running model simulations, analyzing data, and reporting results
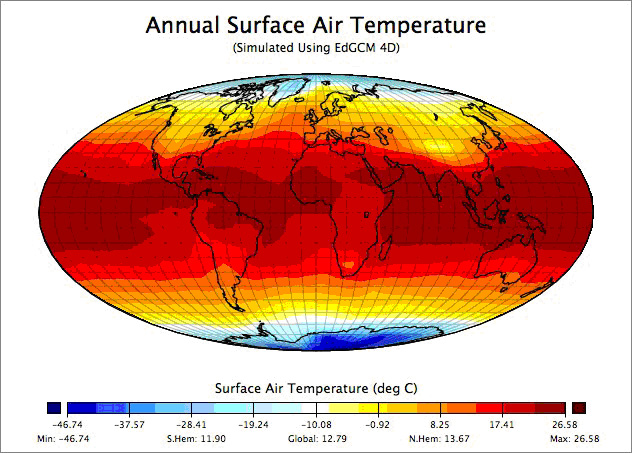
EdGCM Visualization Application (EVA) software is used to create a model of annual, global surface air temperatures on the Earth. Image credit EdGCM
|
|
 |
|
- Customer Challenge
Ray Sterner of the Applied Physics Laboratory needed a data visualization solution that would allow anyone to view and track hurricanes on a website
- Solution Achieved
The summer of 2005 was an unusually active hurricane season, emphasized by record-breaking Katrina in August. Katrina is now considered one of the most costly natural disasters in American history. Although the high profile storm was devastating, it also initiated public interest in storms and weather patterns and prompted demand for better prediction capabilities.
In Katrina's wake, the media hurried to obtain images of the storm to help the public appreciate the extent of the damage when the reality was hard to visualize. Many journal editors searching for images found the Johns Hopkins Applied Physics Laboratory (APL) Ocean Remote Sensing internet site, which is home to thousands of hurricane images in various states of their lifecycles that have been acquired since the early 1990's.
The site, created in 1994 by APL researchers Ray Sterner and Steve Babin, began as a hobby after the pair conceptualized creating a repository for hurricane images that would be accessible by anyone with a computer. In 2005, they added stunning images of Katrina, most of which were processed using IDL ? a leading data visualization and analysis platform widely used in the scientific community.
The Katrina images were eventually featured in some of the most prestigious journals in the world, including National Geographic Magazine, which used images attained from the site for an August 2006 cover story.
Sterner wrote custom software using IDL to extract several channels from AVHRR data. IDL was used to merge the channels and create color images.Left: New Orleans area just before Katrina. The storm can be seen entering at the lower right corner of the image. Right: The same New Orleans area four days after Katrina. Major flooding is visible along the shore of Lake Pontchartrain.
Images Credit Johns Hopkins Applied Physics Laboratory.
Satellites Provide Consistent Information
To study hurricane patterns and behavior, scientists rely largely on satellite imagery, which provides them with the most frequent and accurate data available as a storm front forms, takes its course and dissipates.
The APL's Ocean Remote Sensing site uses imagery acquired from instruments aboard the National Oceanographic and Atmospheric Administration's (NOAA) polar-orbiting weather satellites to track the hurricanes featured on their website. The NOAA satellites orbit the Earth continuously, and can return up to two images per day of any particular point of interest, making the images a good source of change detection and pattern recognition.
Once data are acquired from NOAA's Advanced Very High Resolution Radiometer (AVHHR), Sterner and Babin, a meteorologist, use advanced technology like IDL to produce visualizations of the weather patterns, including enhanced plots, charts, composites, overlays, and more.
Through the life of the site, Sterner has developed innovative processes using IDL to automate and enhance his image analyses. For instance, routines from his public IDL library plot storm movement and wind speed, make more visually intuitive overlay maps, and produce color images. He also used IDL to develop a stand alone application with windows following each hurricane, making important data accessible to anyone using the website.
Visit the APL website at http://fermi.jhuapl.edu/avhrr/index.html.
- IDL allows the researchers to provide processed, up-to-date imagery of hurricanes
- Anyone interested in storm tracking can access easy-to-interpret images and track storm progress
- Using IDL allows the site creators to quickly and easily create new applications and routines to make processing the large amount of images
After Hurricane Katrina, many media outlets used imagery from Sterner and Babin's website, including National Geographic Magazine.
Image Credit Johns Hopkins Applied Physics Laboratory
|
|
 |
|
- Customer Challenge
The National Oceanic and Atmospheric Administration (NOAA) needed to import various data sets onto a spherical representation of the Earth.
NOAA's mission is to support ecosystem management, climate change, freshwater supply and homeland security. In order to reach those goals, they needed to implement several programs to educate public audiences and increase understanding of environmental concerns. Alexcander MacDonald of NOAA had the vision was to create a mechanism that allowed the public to visualize many of the Earth's global features in a "real-life" view.
The SOS engineers encountered a challenge when trying to import data sets from other labs and scientific organizations onto the sphere. The SOS team obtained the data in multiple formats from so many different sources, and needed the right tools to handle all of them. To create an effective visualization, they needed the ability to conveniently aggregate and display the data sets from multiple viewing perspectives onto the sphere.
- Solution Achieved
The National Oceanic and Atmospheric Administration (NOAA) mission is to support ecosystem management, climate change, freshwater supply and homeland security. In order to reach those goals, they needed to implement several programs to educate public audiences and increase understanding of environmental concerns. Alexcander MacDonald of NOAA had the vision was to create a mechanism that allowed the public to visualize many of the Earth's global features in a "real-life" view.
The SOS engineers encountered a challenge when trying to import data sets from other labs and scientific organizations onto the sphere. The SOS team obtained the data in multiple formats from so many different sources, and needed the right tools to handle all of them. To create an effective visualization, they needed the ability to conveniently aggregate and display the data sets from multiple viewing perspectives onto the sphere.
NOAA's Science on a Sphere™ (SOS) program is an innovative project designed to visually depict the Earth's climate, weather and oceans so the public can understand the Earth's systems and how they interact. ExelisVIS's IDL has been instrumental in helping to project SOS scientific data sets onto a giant sphere in a visually stunning and educational demonstration. Alexander MacDonald, director of the NOAA Forecast Systems Laboratory in Boulder, Colorado, pioneered the SOS project. Intended for museums, science centers, schools and other scientific venues, SOS provides a dramatic visualization of complex information in an understandable form.
- Key Benefits
- The team can now look at real-time data on the sphere, and this allows them to use SOS not just a teaching tool, but a research tool as well.
- IDL allows them to create custom programs with a fraction of the code-writing required in another language. IDL allowed them to quickly generate code to accurately project the atmospheric data set onto the sphere.
- To create an effective visualization, IDL allowed them to conveniently aggregate and display the data sets from multiple viewing perspectives onto the sphere.
David Himes, senior software engineer for SOS, was brought onto the SOS team as the primary software developer. An early prototype of the system had already existed, and Himes was hired to improve on the early system by increasing the frame rate to full 3 Image courtesy NOAA
|
|
Image courtesy NOAA
|
Image courtesy NOAA
|
Image courtesy NOAA
|
Image courtesy NOAA
|
|
|